
Voltage Distribution and Waveform Analysis in a Resistive Network
Overview
Tools and Components Used
-
Breadboard
-
Assorted resistors
-
5 V DC power supply
-
Digital multimeter
-
Function generator
-
Oscilloscope
-
Jumper wires
-
Ohm’s Law and equivalent resistance calculations
In order to compare theoretical circuit predictions with actual measurements, I examined, constructed, and tested a resistive network for this project. Before building the circuit on a breadboard, I determined the anticipated voltage distribution across several resistors using Ohm's Law and equivalent resistance analysis. I used an oscilloscope and function generator to see how various waveforms reacted within the circuit after verifying the DC voltage data. My knowledge of electrical measurements, circuit analysis, and waveform behavior in resistive networks has improved as a result of this study.
Key Steps
1. Developed the Logic Functions
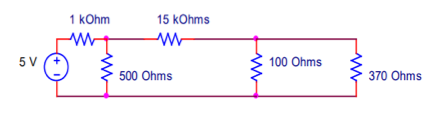
I began by analyzing the resistor network using Ohm’s Law and calculating the equivalent resistance. Before constructing the circuit, I simplified the series and parallel resistor combinations to determine the total resistance of the network. Based on these calculations, I predicted the voltage drop across each resistor and established a set of theoretical values to compare later with my experimental measurements.
2. Constructed the Resistive Network
I used individual resistors to build the circuit on a breadboard after finishing the calculations. I connected resistors in series to achieve equal resistance values because some of the resistor values needed by the schematic were not accessible. For instance, I used a 910 Ω and 90 Ω resistor to generate a 1 kΩ resistor and a 300 Ω and 200 Ω resistor to create a 500 Ω resistor. To guarantee that the finished circuit matched the desired design, careful preparation was necessary.

3. Measured Voltage Across Circuit Components
After constructing the circuit, I connected it to a 5 V DC power source and measured the voltage across each resistor using a digital multimeter. While the circuit was running, I carefully positioned the multimeter probes across each component and noted the observed values. I was able to assess how closely the actual circuit matched my calculations' theoretical predictions thanks to these measurements.

4. Observed Waveforms Using Laboratory Instruments
After confirming the circuit's DC behavior, I connected an oscilloscope to view waveform behavior and swapped out the DC power source for a function generator. I started by creating a square wave signal at about 1 kHz, then I looked at the waveform that appeared across one of the resistors. The oscilloscope verified that the circuit correctly reacted to the incoming signal by displaying the anticipated waveform shape and frequency.

5. Analyzed Sinusoidal Signals and Amplitude Changes
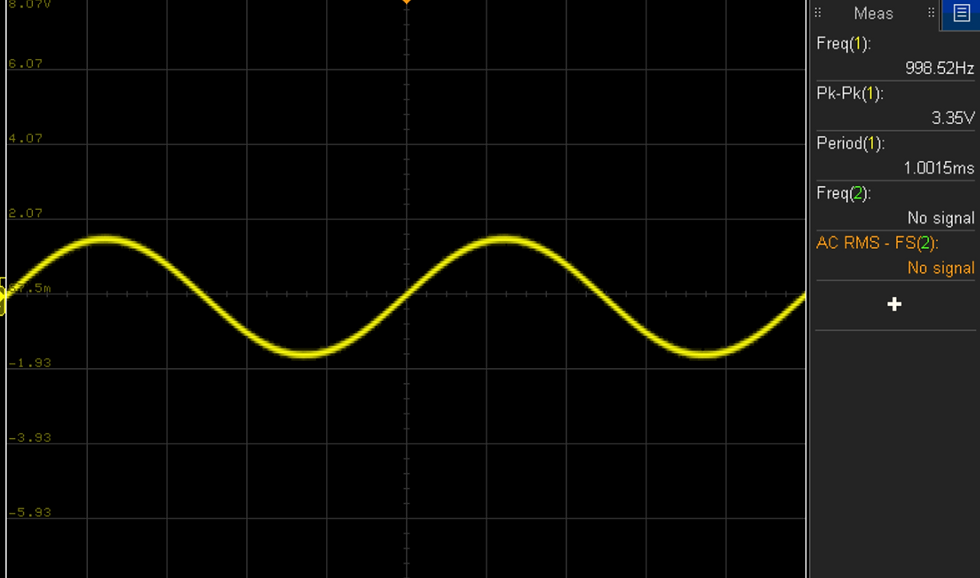
I then used the oscilloscope to view the signal after setting up the function generator to create a sinusoidal waveform. I next increased the signal's amplitude while keeping an eye on the waveform's changes. The findings demonstrated that while keeping the frequency constant, raising the generator's amplitude raised the waveform's peak-to-peak voltage. I now have a better understanding of signal characteristics and how laboratory equipment may be used to study waveform parameters.
Results and Documentation
All things considered, this study effectively illustrated the connection between theoretical circuit analysis and practical electrical measurements. When various signal types and amplitudes were applied, the observed waveforms behaved as predicted, and the measured voltages closely matched the computed values. I obtained hands-on experience using engineering tools and verifying electrical concepts in a physical circuit through circuit fabrication, voltage verification, and waveform analysis.
I produced a thorough laboratory report that details the entire circuit analysis, computations, construction procedure, voltage measurements, waveform observations, and experimental outcomes if you're looking for a more thorough description of this project. The report offers more technical information and shows that I am capable of recording engineering work, communicating technological discoveries, and formally presenting experimental results.